Problem Set "STATS4STEM MASTER - #9 - SAMPLING DISTRIBUTIONS" id:[PSABKEM]
| 1) Problem #PRAJU6V "PRAJU6V - 255520 - The parameter of ..." |
|
A)
The parameter of a population is 85. Which of the following sampling distributions are biased? Select all that apply.  © STATS4STEM.ORG |
Check All That Apply:
|


|
Hints: |
|
|
|
|
|
B)
Which sampling distribution is the best estimator of the statistic? |
Multiple Choice:
|
| 2) Problem #PRAJU2Y "PRAJU2Y - 255399 - Eat-A-Donut offer..." |
A)
Eat-A-Donut offers the following donut selection: People pay by the gram. The distribution of individual donut weights (in grams) is found below: Powdered ~ N(25, 1) Boston ~ N(29, 1.3) Almond ~ N(26, 1.1) Jelly ~ N(28, 1.2) Vegan ~ N(26.5, 0.8) Glazed ~ N(24, 0.7) Jimmy is a regular and he always orders 12 Vegan donuts. What is the probability that the average donut weight for his order of 12 is greater than 26.9 grams? Round answer to the nearest hundredth. Link to z-table © STATS4STEM.ORG |
Algebraic Expression:
|
|
Hints: |
 |
|
|
|
|
|
|
|
|
|
|
|
B)
Without doing any calculations, the probability that one randomly chosen vegan donut weighs more than 26.9 grams will be: |
Multiple Choice:
|
|
C)
Calculate the probability that one randomly chosen vegan donut weighs more than 26.9 grams. Round answer to the nearest hundredth. |
Algebraic Expression:
|
|
Hints: |
|
|
|
|
|
|
|
|
|
|
|
|
|
D)
A customer is buying a vegan donut for his boss, but his boss told him that the donut must weigh more than 26.9 grams. The customer asks the staff to repeatedly pick a random donut and weigh it until an acceptable donut is found. What is the probability that the fourth donut will be the first acceptable donut? Round answer to the nearest hundredth. |
Algebraic Expression:
|
|
Hints: |
|
|
|
|
|
|
|
E)
What is the probability that an order of dozen vegan donuts will have exactly 3 donuts that weigh more than 26.9 grams? Round answer to the nearest hundredth. |
Algebraic Expression:
|
|
Hints: |
|
|
|
|
|
P(X=x) = dbinom(x, n, p) Using the TI-83: P(X=x) = binompdf(n, p, x) |
|
P(X=3) = dbinom(3, 12, 0.31) Using the TI-83: P(X=3) = binompdf(12, 0.31, 3) |
|
|
| 3) Problem #PRAE8Z7 "PRAE8Z7 - 147743 - Which statement i..." |
|
Which statement is correct? © STATS4STEM.ORG |
Multiple Choice:
|
| 4) Problem #PRAE82A "PRAE82A - 147746 - Which statement i..." |
|
Which statement is correct? © STATS4STEM.ORG |
Multiple Choice:
|
| 5) Problem #PRAE8Z8 "PRAE8Z8 - 147744 - Which statement i..." |
|
Which statement is correct? © STATS4STEM.ORG |
Multiple Choice:
|
| 6) Problem #PRAE8Z9 "PRAE8Z9 - 147745 - Which statement i..." |
|
Which statement is correct? © STATS4STEM.ORG |
Multiple Choice:
|
| 7) Problem #PRAE82W "PRAE82W - 147765 - Which statement i..." |
|
Which statement is correct? © STATS4STEM.ORG |
Multiple Choice:
|
| 8) Problem #PRAE8ZP "PRAE8ZP - 147727 - When they send ou..." |
|
A)
When they send out their fundraising letter, a nonprofit typically gets a response from about 10% of the of the people on their mailing list. When nonprofits run mailing campaigns, they often vary in size ( for example 1 mailing may include 100 mailings, another may include 60). To see what the response rate may be for mailings of various sizes, they did a simulation using sample sizes of 30, 50, 130, and 250. For each sample size they simulated 2000 mailings where the success rate was 10% (in other words p=.10). They then constucted a histogram of the 2000 mailings. Lets go ahead and use R, in combination with the rbinom function, to simulate each scenario to better understand how the results of our samples will vary with different sample sizes. Specifically, simulate 1000 observations where each observation simulates a sampling of 80 mailings where the response rate is 20%. Lets further say that we wanted to simulate this scenario 1000 times to get a better sense of the sampling variablility. To do this in RStudio, we need to use the following code: ### this will store 1000 numbers in x. The numbers stored are a count of how many people actually responded in ### 1 random simulation of 80 mailings where the response rate is 20% set.seed(1) x=rbinom(1000, 80, .2) ###This allows you to actually see your outcomes. x[1:10] Review the R output. On the 1st mailing (i.e. the first simulation) how many people responded? © STATS4STEM.ORG |
Algebraic Expression:
|
|
Hints: |
|
|
|
B)
Review the R output again. On the 4th mailing (i.e. the fourth simulation) how many people responded? |
Algebraic Expression:
|
|
Hints: |
|
|
|
C)
Now lets create a histogram of our simulation to get a better feel for the sampling distribution. Now, refering to your histogram in RStudio, how likely is it that you will get more than 25 responses? |
Multiple Choice:
|
|
D)
Using RStudio, independently simulate the the following for sample sizes: 30, 50, 130, and 250. Then for each of the four sample size simulations, have R output a histogram. Then sketch each of the 4 histograms in your notebook. Explain how these 4 histograms change as the sample size increases. Be sure to talk about shape, center, and spread. Click on this link for a quick review on shape, center, and spread. |
|
Ungraded Open Response: |
| 9) Problem #PRAE82E "PRAE82E - 147750 - A friend of yours..." |
|
A friend of yours lost money on a coin toss. He claims that the coin was not fair and that he was cheated. He went on to explain that after the coin toss, he wanted to prove that the coin was not fair by tossing it 100 times and counting the percentage of heads. Of the 100 coin tosses, 44 percent were heads. Is this strong evidence that the coin is not fair? Using R, simulate 10000 experiments of tossing a fair coin, where p=0.5, 100 times. Then construct a histogram of your results to answer the above stated question. © STATS4STEM.ORG |
Multiple Choice:
|
|
Hints: |
|
|
|
x=rbinom(10000, 100, .5) p=x/100 hist(p, breaks=20) |
|
|
| 10) Problem #PRAE82F "PRAE82F - 147751 - A friend of yours..." |
|
A)
A friend of yours lost money on a coin toss. He claims that the coin was not fair and that he was cheated. He went on to explain that after the coin toss, he wanted to prove that the coin was not fair by tossing it 1000 times and counting the percentage of heads. Of the 1000 coin tosses, 44 percent were heads. Is this strong evidence that the coin is not fair? Using Rweb, simulate 10000 experiments of tossing a coin 1000 times. Then construct a histogram of your results to answer the above stated question. Hint: For your simulation, assume that the coin is fair. © STATS4STEM.ORG |
Multiple Choice:
|
|
Hints: |
|
|
|
x=rbinom(10000, 1000, .5) p.hat=x/1000 hist(p.hat, breaks=20) |
|
|
|
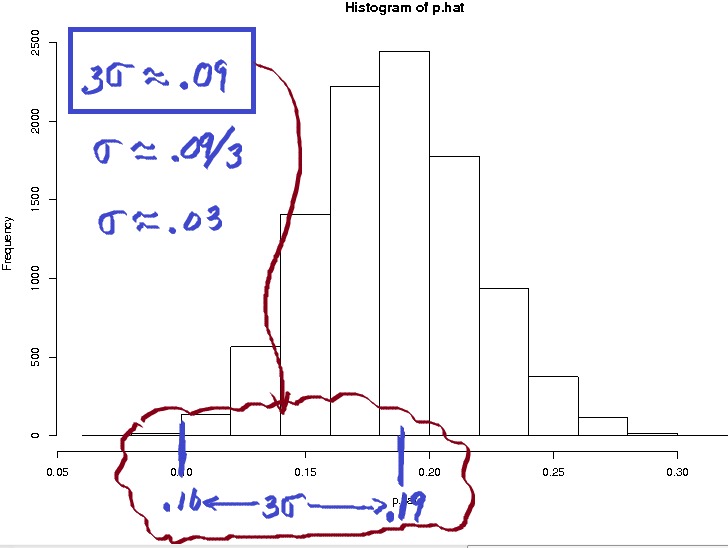
B)
Refer to the histogram created in the previous problem. If needed, the code to create the histogram can be found below: x=rbinom(10000, 100, .5) p.hat=x/100 hist(p.hat, breaks=20) Inspect the histogram and approximate the standard deviation of the histogram. The approximate standard deviation is: |
Multiple Choice:
|
|
Hints: |
|
|
|
|
|
.15/3 = .05 |
|
C)
Refer to the histogram created in the previous problem. If needed, the code to create the histogram can be found below: x=rbinom(10000, 100, .5) p.hat=x/100 hist(p.hat, breaks=20) For this histogram, does it appear as if p-hat (p.hat in the R code) is an unbiased estimator of p? Hint: p=.5 |
Multiple Choice:
|
|
D)
As the sample size increases, what can you observe about the variance of the sampling distribution? |
Multiple Choice:
|
| 11) Problem #PRAE88A "PRAE88A - 147932 - In a large city, ..." |
|
A)
In a large city, 70% of the people prefer Candidate A. Suppose 100 people from this city were sampled. As a decimal, what is the mean of the sampling distribution of p-hat? © STATS4STEM.ORG |
Algebraic Expression:
|
|
B)
Using Rweb and the code found below, create a histogram of the sampling distribution for p-hat. x=rbinom(10000, 100, .7) p.hat=x/100 hist(p.hat, breaks=20) # construct a normal probability plot qqnorm(p.hat) qqline(p.hat) Review the histogram and the normal probability plot to assess normality. Does the sampling distribution for p-hat appear to be normal? Hint: Here is a link to review the normal probability plot. |
Multiple Choice:
|
|
C)
Review your histogram again. Use the following code if needed. x=rbinom(10000, 100, .7) p.hat=x/100 hist(p.hat, breaks=20) Using what you know about the density curve of the normal distribution, estimate the standard deviation through visual inspection of the histogram. |
Multiple Choice:
|
|
D)
What is the standard deviation of the sampling distribution of p-hat? Round answer to the nrearest thousands. |
Algebraic Expression:
|
|
Hints: |
|
|
|
|
|
E)
Are the required conditions been met to use the normal approximation for p-hat? Hint: Make sure you remember these requirement and always use them before assuming normality. |
Multiple Choice:
|
|
F)
We can approximate the sampling distribution of p-hat with which distribution? |
Multiple Choice:
|
|
G)
What is the probability p-hat will be less than .65? Anwer as a decimal rounded to nearest hundred. |
Algebraic Expression:
|
|
Hints: |
|
|
|
|
|
|
|
|
|
TYPE .14 (ROUNDED) |
|
H)
What is the probability p-hat will fall between .64 and .73? Anwer as a decimal rounded to nearest hundred. |
Algebraic Expression:
|
|
Hints: |
|
|
|
|
|
|
|
|
ANSWER = .65 ROUNDED |
| 12) Problem #PRAE882 "PRAE882 - 147955 - In the United Sta..." |
|
A)
In the United States, about 17% of the people have blue eyes. Suppose 200 people from this city were sampled. As a decimal, what is the mean of the sampling distribution of p-hat? Source: onlinestatbook.com © STATS4STEM.ORG |
Algebraic Expression:
|
|
Hints: |
|
|
|
|
|
|
|
|
|
|
|
B)
Using Rweb and the code found below, create a histogram of the sampling distribution for p-hat. x=rbinom(10000, 200, .17) p.hat=x/200 hist(p.hat, breaks=20) # construct a normal probability plot qqnorm(p.hat) qqline(p.hat) Review the histogram and the normal probability plot to assess normality. Does the sampling distribution for p-hat appear to be normal? Hint: Here is a link to review the normal probability plot. |
Multiple Choice:
|
|
C)
Review your histogram again. Use the following code if needed. x=rbinom(10000, 200, .17) p.hat=x/200 hist(p.hat, breaks=20) Using what you know about the density curve of the normal distribution, estimate the standard deviation through visual inspection of the histogram. |
Multiple Choice:
|
|
Hints: |
|
|
|
|
|
D)
What is the standard deviation of the sampling distribution of p-hat? Round answer to the nrearest thousands. |
Algebraic Expression:
|
|
Hints: |
|
|
|
|
|
E)
Are the required conditions been met to use the normal approximation for p-hat? Hint: Make sure you remember these requirement and always use them before assuming normality. |
Multiple Choice:
|
|
F)
Which distribution can be used to approximate the sampling distribution of p-hat? |
Multiple Choice:
|
|
G)
What is the probability p-hat will be less than .15? Anwer as a decimal rounded to nearest hundred. |
Algebraic Expression:
|
|
Hints: |
|
|
|
z=-0.74 |
|
|
|
|
|
H)
What is the probability p-hat will fall between .13 and .19? Anwer as a decimal rounded to nearest hundredth. |
Algebraic Expression:
|
|
Hints: |
|
|
|
|
|
|
|
|
|
|
|
|
|
|
|
I)
What is the probability p-hat will be greater than .20? Anwer as a decimal rounded to nearest hundred. |
Algebraic Expression:
|
|
Hints: |
|
|
|
|
|
|
|
|
|
P(p-hat > 0.20) = 0.1335 ANSWER = 0.13 (ROUNDED) |
|
J)
What is the probability p-hat will be less than .14 or greater than .18? Anwer as a decimal rounded to nearest hundred. |
Algebraic Expression:
|
|
Hints: |
|
|
|
|
|
|
|
|
|
Remember, if A & B are Disjoint. P(A OR B) = P(A) + P(B) |
|
|
|
|
|
|
| 13) Problem #PRAE8BJ "PRAE8BJ - 147072 - A population has ..." |
|
A)
A population has a mean of 50 and a standard deviation of 6. (a) When n=16, what are the mean of the sampling distribution of x-bar? Round answer to the nearest hundredth. © STATS4STEM.ORG |
Algebraic Expression:
|
|
Hints: |
|
Link to Rweb Link to code |
 |
|
|
|
B)
A population has a mean of 50 and a standard deviation of 6. (b) When n=16, what is the standard deviation of the sampling distribution of x-bar? Round answer to the nearest hundredth. |
Algebraic Expression:
|
|
Hints: |
 |
|
=6/4 =1.5 |
|
C)
A population has a mean of 50 and a standard deviation of 6. (c) When n=20, what is the mean of the sampling distribution of x-bar? Round answer to the nearest hundredth. |
Algebraic Expression:
|
|
Hints: |
|
Link to Rweb Link to code |
 |
|
|
|
D)
A population has a mean of 50 and a standard deviation of 6. (d) When n=20, what is the standard deviation of the sampling distribution of x-bar? Round answer the nearest hundredth. |
Algebraic Expression:
|
|
Hints: |
|
|
|
=6/4.4721 =1.34 |
| 14) Problem #PRAE9HX "PRAE9HX - 148231 - A ruler manufactu..." |
|
A)
A ruler manufacturing company has a machine that manufactures rulers that are normally distributed with a mean of 12 inches long and standard deviation of .01 inches. Find the probability that a randomly selected ruler will have a length greater than 12.005 inches. Answer as a decimal rounded to the nearest hundredth. Link to z-table © STATS4STEM.ORG |
Algebraic Expression:
|
|
Hints: |
|
|
|
|
|
|
|
|
|
|
|
|
|
|
|
B)
Refering to the previous problem, the manufacturing engineer decides to randomly sample 5 rulers to ensure the product is conforming to quality standards. It is expected that the means of the samples will vary from sample to sample. This sampling distribution of the sample means will have which distribution? |
Multiple Choice:
|
|
C)
What is the probability that a random sample of 5 rulers has a mean greater than 12.005? Answer as a decimal rounded to the nearest hundredths. |
Algebraic Expression:
|
|
Hints: |
|
|
 Therefore,  |
|
z = 0.005/0.00447 z = 1.12 |
|
Therefore, P(x-bar > 12.005) = 1 - 0.8686 = 0.13 (ROUNDED) |
|
D)
Will the probability of getting a mean greater 12.005 increase or decrease if the engineer decides to increase the sample size from 5 to 10? |
Multiple Choice:
|
|
E)
What is the probability that a random sample of 10 rulers has a mean between 12.003 and 12.006? Answer as a decimal rounded to the nearest hundredths. |
Algebraic Expression:
|
|
Hints: |
|
|
|
|
|
|
|
z12.003 = (12.003 - 12) / .003162 = 0.9486 |
|
From z-table: P(x-bar < 12.006) - P(x-bar < 12.003) = 1.90 - 0.95 = .1424 |
|
|
| 15) Problem #PRAE9HW "PRAE9HW - 148230 - The length of tim..." |
|
A)
The length of time it takes a person to play a certain video game is normally distributed with a mean of 20 minutes and standard deviation of 3 minutes. Find the probability it takes a random individual less than 16 minutes. Round answer to the nearest hundredth. Link to z-table. © STATS4STEM.ORG |
Algebraic Expression:
|
|
Hints: |
 |
|
|
|
|
|
|
|
B)
Now, what is the probability that a sample of 2 individuals will have an average time less than 16 minutes. Round answer to the nearest hundredth. |
Algebraic Expression:
|
|
Hints: |
|
|
|
Therefore, |
|
z = -4/2.1213 z = -1.89 |
|
|
|
C)
Now, what is the probability that a sample of 10 individuals will have an average time greater than 21.4 minutes. Round answer to the nearest hundredth. |
Algebraic Expression:
|
|
Hints: |
|
|
|
Therefore, |
|
z = 1.4/0.949 z = 1.48 |
|
|
|
D)
Now, what is the probability that a sample of 8 individuals will have an average time between 19 and 22 minutes. Answer as a decimal rounded to the nearest hundredth. |
Algebraic Expression:
|
|
Hints: |
|
|
|
Therefore, |
|
z19 = (19 - 20)/(3/√8) |
|
z19 = -1/1.061 = -0.94 |
|
P(19 < X-BAR < 22) = 0.9706 - 0.1736 = 0.797 or 0.80 (ROUNDED) |
| 16) Problem #PRAE8BB "PRAE8BB - OSB-CH7 #2" |
|
A)
Given a test that is normally distributed with a mean of 100 and a standard deviation of 12, find the probability that a single score drawn at random will be greater than 110. Answer as decimal rounded to the nearest hundredth. © STATS4STEM.ORG |
Algebraic Expression:
|
|
B)
Given a test that is normally distributed with a mean of 100 and a standard deviation of 12, find the probability that a sample of 25 scores will have a mean greater than 105. Answer as decimal rounded to the nearest hundredth. |
Algebraic Expression:
|
|
C)
Given a test that is normally distributed with a mean of 100 and a standard deviation of 12, find the probability that a sample of 64 scores will have a mean less than 97.8. Answer as decimal rounded to the nearest hundredth. |
Algebraic Expression:
|
|
D)
Given a test that is normally distributed with a mean of 100 and a standard deviation of 12, find the probability that the mean of a sample of 16 scores will be either less than 95 or greater than 105. Answer as decimal rounded to the nearest hundredth. |
Algebraic Expression:
|
| 17) Problem #PRAE9TM "PRAE9TM - 148500 - simulation sampling proportions - modified copy of 147751" |
|
A)
A friend of yours lost money on a coin toss. He claims that the coin was not fair and that he was cheated. He went on to explain that after the coin toss, he wanted to prove that the coin was not fair by tossing it 200 times and counting the percentage of heads. Of the 200 coin tosses, 35 percent were heads. Is this strong evidence that the coin is not fair? Link to R code needed for simulation Using Rweb, simulate 10000 experiments of tossing a coin 200 times (make sure to modify the code where it is needed to answer this question correctly!). Then construct a histogram of your results to answer the above stated question. Hint: For your simulation, assume that the coin is fair (p=.5). © STATS4STEM.ORG |
Multiple Choice:
|
|
Hints: |
|
|
|
B)
Refer to the histogram created in the previous problem. If needed, the code to create the histogram can be found below: x=rbinom(10000, 200, .5) p.hat=x/200 hist(p.hat, breaks=20) Inspect the histogram and approximate the standard deviation of the histogram. The approximate standard deviation is: |
Multiple Choice:
|
|
Hints: |
|
|
|
|
|
.105/3 = .035 |
|
C)
Refer to the histogram created in the previous problem. If needed, the code to create the histogram can be found below: x=rbinom(10000, 200, .5) p.hat=x/200 hist(p.hat, breaks=20) For this histogram, does it appear as if p-hat (p.hat in the R code) is an unbiased estimator of p? Hint: p=.5 |
Multiple Choice:
|
|
D)
As the sample size increases, what can you observe about the variance of the sampling distribution? |
Multiple Choice:
|
| 18) Problem #PRAE9T9 "PRAE9T9 - Copy of 148231 - sampling means" |
|
A)
A ruler manufacturing company has a machine that manufactures rulers that are normally distributed with a mean of 12 inches long and standard deviation of .02 inches. Find the probability that a randomly selected ruler will have a length greater than 12.01 inches. Round answer to the nearest hundredth. Link to z-table © STATS4STEM.ORG |
Algebraic Expression:
|
|
Hints: |
|
|
|
|
|
|
|
B)
Refering to the previous problem, the manufacturing engineer decides to randomly sample 25 rulers to ensure the product is conforming to quality standards. It is expected that the means of the samples will vary from sample to sample. This sampling distribution of the sample means will have which distribution? |
Multiple Choice:
|
|
C)
What is the probability that a random sample of 25 rulers has a mean greater than 12.005? Answer as a decimal rounded to the nearest hundredths. |
Algebraic Expression:
|
|
D)
Will the probability of getting a mean greater 12.005 increase or decrease if the engineer decides to decrease the sample size from 20 to 10? |
Multiple Choice:
|
|
E)
What is the probability that a random sample of 16 rulers has a mean between than 11.995 and 12.003? Answer as a decimal rounded to the nearest hundredths. |
Algebraic Expression:
|
|
Hints: |
|
|
|
|
 |
|
|
| 19) Problem #PRAE9UF "PRAE9UF - 148526 - sampling dist of mu - stats4stem.org" |
|
Create small paragraph of a few sentences using the following words/symbols - make sure not to omit any of the words: x-bar, population, unbiased, parameter, statistic, estimator, estimate, sample, μ (feel free to use mu) © STATS4STEM.ORG |
|
Ungraded Open Response: |
| 20) Problem #PRAE9UK "PRAE9UK - Sampling Proportions - copy of 147955" |
|
A)
In a given year, J and J Manufacturing produces 10,000 widgets, where 19% of the products are defective. Suppose the manufacturing engineers decide to sample 150 widgets. As a decimal, what is the mean of the sampling distribution of p-hat? © STATS4STEM.ORG |
Algebraic Expression:
|
|
Hints: |
 |
|
|
|
|
|
B)
Using Rweb and the code found below, create a histogram of the sampling distribution for p-hat. x=rbinom(10000, 150, .19) p.hat=x/150 hist(p.hat, breaks=15) # construct a normal probability plot qqnorm(p.hat) qqline(p.hat) Review the histogram and the normal probability plot to assess normality. Does the sampling distribution for p-hat appear to be normal? Hint: Here is a link to review normal probability plots. |
Multiple Choice:
|
|
C)
Review your histogram again. Use the following code if needed. x=rbinom(10000, 150, .19) p.hat=x/150 hist(p.hat, breaks=15) Using what you know about the density curve of the normal distribution, estimate the standard deviation through visual inspection of the histogram. |
Multiple Choice:
|
|
Hints: |
 |
|
D)
Round answer to the nearest thousands (3 decimal places). What is the standard deviation of the sampling distribution of p-hat? In other words, calculate p-hat using the formula for standard deviation? Round answer to the nearest thousands (3 decimal places). |
Algebraic Expression:
|
|
Hints: |
 |
|
|
|
E)
Are the required conditions been met to use the normal approximation for p-hat? Hint: Make sure you remember these requirement and always use them before assuming normality. |
Multiple Choice:
|
|
F)
We can approximate the sampling distribution of p-hat with which distribution? |
Multiple Choice:
|
|
Hints: |
 |
|
G)
What is the probability p-hat will be less than .15? Anwer as a decimal rounded to nearest hundredth. |
Algebraic Expression:
|
|
Hints: |
|
|
|
Calculate z = (0.15 - 0.19)/0.032 |
|
|
|
|
|
H)
What is the probability p-hat will fall between .14 and .20? Anwer as a decimal rounded to nearest hundredth. |
Algebraic Expression:
|
|
Hints: |
 |
|
|
|
I)
What is the probability p-hat will be greater than .20? Anwer as a decimal rounded to nearest hundredth. |
Algebraic Expression:
|
|
Hints: |
|
|
|
|
|
J)
What is the probability p-hat will fall between .15 and .18? Anwer as a decimal rounded to nearest hundredth. |
Algebraic Expression:
|
|
Hints: |
|
|
|
|
| 21) Problem #PRAE9SS "PRAE9SS - 148474 - ILL - #7 - Central Limit Theorm" |
|
A)
The typical computer random number generator yields numbers from a uniform distribution of values between 0 and 1, with a mean of 0.500 and a standard deviation of 0.289. If 50 random numbers are generated, find the probability that their mean is between 0.6 and 0.7. Answer as a decimal rounded to the nearest hundred. |
Algebraic Expression:
|
|
B)
Would it be unusual to generate 50 such numbers and get a mean between 0.6 and 0.7? |
Multiple Choice:
|
| 22) Problem #PRAE9JY "PRAE9JY - OSB-CH7 #2" |
|
A)
Given a test that is normally distributed with a mean of 80 and a standard deviation of 6, find the probability that a single score drawn at random will be less than 72. Answer as decimal rounded to the nearest hundredth. © STATS4STEM.ORG |
Algebraic Expression:
|
|
B)
Given a test that is normally distributed with a mean of 80 and a standard deviation of 6, find the probability that a sample of 25 scores will have a mean greater than 81.5. Answer as decimal rounded to the nearest hundredth. |
Algebraic Expression:
|
|
C)
Given a test that is normally distributed with a mean of 80 and a standard deviation of 6, find the probability that a sample of 64 scores will have a mean less than 79.5. Answer as decimal rounded to the nearest hundredth. |
Algebraic Expression:
|
|
D)
Given a test that is normally distributed with a mean of 80 and a standard deviation of 6, find the probability that the mean of a sample of 16 scores will be either less than 79 or greater than 81.3. Answer as decimal rounded to the nearest hundredth. |
Algebraic Expression:
|
|
E)
Given a test that is normally distributed with a mean of 80 and a standard deviation of 6, find the probability that a single score drawn at random will be between a 74 and 79. Answer as decimal rounded to the nearest hundredth. |
Algebraic Expression:
|
| 23) Problem #PRAE9Y2 "PRAE9Y2 - 148668 - Sampling Proportions - copy of 147955 - stats4stem" |
|
A)
70 percent of all homes do not have carbon monoxide detectors in their homes. Suppose that the fire department decides to conduct random inspection of 100 houses. For this situation, what is the mean of the sampling distribution of p-hat? Give your answer as a decimal. © STATS4STEM.ORG |
Algebraic Expression:
|
|
Hints: |
|
|
|
|
|
|
B)
Using what you know about the density curve of the normal distribution, estimate the standard deviation through visual inspection of the histogram below. |
Multiple Choice:
|
|
Hints: |
|
|
|
|
|
C)
What is the standard deviation of the sampling distribution of p-hat? In other words, calculate the standard deviation of p-hat using the formula for standard deviation of p-hat? ***Round answer to the nearest thousands (3 decimal places) *** |
Algebraic Expression:
|
|
Hints: |
 |
|
|
|
D)
Are the required conditions been met to use the normal approximation for p-hat? Hint: Make sure you remember these requirement and always use them before assuming normality. |
Multiple Choice:
|
|
E)
We can approximate the sampling distribution of p-hat with which distribution? |
Multiple Choice:
|
|
Hints: |
|
|
|
F)
What is the probability p-hat will be less than 64%? Anwer as a decimal rounded to nearest hundredth. Link to z-table |
Algebraic Expression:
|
|
Hints: |
 |
|
|
|
|
|
G)
What is the probability p-hat will fall between .67 and .75? Anwer as a decimal rounded to nearest hundredth. Link to z-table |
Algebraic Expression:
|
|
Hints: |
|
|
|
|
|
|
|
|
|
H)
What is the probability p-hat will be greater than .76? Anwer as a decimal rounded to nearest hundredth. |
Algebraic Expression:
|
|
Hints: |
|
|
|
|
|
|
| 24) Problem #PRAE9Y7 "PRAE9Y7 - normality assumptions for p-hat using Rweb simulation - stats4stem" |
|
We know that probabilities for p-hat can be calculated by assuming p-hat is normally distributed with a mean of p and a standard deviation of sqrt(p*q/n). However, this is only in the case where the population is at least 10 times as large as the sample and n*p and n*q are both greater than or equal to 10. Why are the rules needed? Use the code found below with Rweb, see what happens when the last two (of the three) rules are broken. Specifically, is the sampling distribution still normal? Link to R Code Write a short summary of what you observed. © STATS4STEM.ORG |
|
Ungraded Open Response: |
| 25) Problem #PRAE9Y9 "PRAE9Y9 - ILL - CLT" |
|
The average age of lawyers is 43.6 years, with a standard deviation of 5.1 years. If a law firm employs 50 lawyers, find the probability that the average age of the group is greater than 44.2 years old. Answer as a decimal rounded to the nearest hundredth. © STATS4STEM.ORG |
Algebraic Expression:
|
| 26) Problem #PRAE9Y8 "PRAE9Y8 - ILL - CLT" |
|
The average price of a pound of sliced bacon is $2.02. Assume the standard deviation is $0.08. If a random sample of 40 one-pound packages is selected, find the probability that the mean of the sample willl be less than $2.00. Answer as a decimal rounded to the nearest hundredth. |
Algebraic Expression:
|
|
Hints: |
|
|
|
|
|
|
| 27) Problem #PRAE9ZA "PRAE9ZA - 148676 - Are p-hat and x-b..." |
|
A)
Are p-hat and x-bar random variables? © STATS4STEM.ORG |
Multiple Choice:
|
|
B)
Are p and μ random variables? |
Multiple Choice:
|
| 28) Problem #PRAFARK "PRAFARK - ILL- CLT" |
|
A)
The average time it takes a group of adults to complete a certain achievement test is 46.2 minutes. The standard deviation is 8 minutes. a. Find the probability that a randomly selected adult will complete the test in less than 43 minutes. Round answer to the nearest hundredth. Link to z-table © STATS4STEM.ORG |
Algebraic Expression:
|
|
B)
b) Find the probability that, if 36 randomly selected adults take the test, the mean time it takes the group to complete the test will be less than 43 minutes. Round answer to the nearest hundredth. |
Algebraic Expression:
|
|
C)
c) Does it seem reasonable that an adult would finish the test in less than 43 minutes? |
Multiple Choice:
|
|
D)
d) Does it seem likely that the mean of the 36 adults could be less than 43 minutes? |
Multiple Choice:
|
| 29) Problem #PRAFARX "PRAFARX - samplind distributions - stats4stem.org" |
|
A)
Are statistics random variables? © STATS4STEM.ORG |
Multiple Choice:
|
|
B)
As the sample size increases, what happens to the standard deviation or variance of your sampling distribution for that statistic. |
Multiple Choice:
|
| 30) Problem #PRAFAQ8 "PRAFAQ8 - ILL - CLT" |
|
The mean score on a dexterity test for 12-year-olds is 30. The standard deviation is 5. If a psychologist administers the test to a class of 22 students, find the probability that the mean of the sample will be between 27 and 31. Round answer to the nearest hundredth. © STATS4STEM.ORG |
Algebraic Expression:
|
| 31) Problem #PRAFARZ "PRAFARZ - 148668 - Sampling Proportions - copy of 147955 - stats4stem" |
|
A)
57 percent of all homes have high speed internet access in their homes. Suppose that census bureau randomly surveys 144 houses nationwide. For this situation, what is the mean of the sampling distribution of p-hat? Round answer to the nearest hundredth. © STATS4STEM.ORG |
Algebraic Expression:
|
|
B)
What is the standard deviation of the sampling distribution of p-hat? In other words, calculate the standard deviation of p-hat using the formula for standard deviation of p-hat? Round answer to the nearest thousands (3 decimal places). |
Algebraic Expression:
|
|
Hints: |
|
|
|
|
|
C)
Are the required conditions been met to use the normal approximation for p-hat? Hint: Make sure you remember these requirement and always use them before assuming normality. |
Multiple Choice:
|
|
D)
We can approximate the sampling distribution of p-hat with which distribution? |
Multiple Choice:
|
|
E)
What is the probability p-hat will be less than 64%? Anwer as a decimal rounded to nearest hundredth. |
Algebraic Expression:
|
|
F)
What is the probability p-hat will fall between .56 and .66? Anwer as a decimal rounded to nearest hundredth. |
Algebraic Expression:
|
|
Hints: |
|
|
|
|
|
|
|
G)
What is the probability p-hat will be greater than .55? Anwer as a decimal rounded to nearest hundredth. |
Algebraic Expression:
|
|
Hints: |
|
|
|
|
| 32) Problem #PRAFARY "PRAFARY - ILL- CLT" |
|
A)
The average cholesterol content of a certain brand of eggs is 215 miligrams, and the standard deviation is 15 miligrams. Assume that the variability is normally distributed. If a single egg is selected, find the probability that the cholesterol content will be greater than 220 miligrams. Answer as a decimal rounded to the nearest hundredth. Link to z-table © STATS4STEM.ORG |
Algebraic Expression:
|
|
B)
If a sample of 25 eggs is selected, find the probability that the mean of the sample will be larger than 220 milligrams. |
Algebraic Expression:
|
| 33) Problem #PRAJB5K "PRAJB5K - 240104 - A local newspaper..." |
|
A)
A local newspaper randomly asks 50 families the following question: “Do you own a house or rent an apartment?”. It is known by the US Census Bureau that 64% of all families in this region own a house. What is the mean of the sampling distribution for p-hat, where p-hat is the proportion who indicate that they own a house? Round answer to the nearest hundredth. © STATS4STEM.ORG |
Algebraic Expression:
|
|
Hints: |
|
|
|
|
|
B)
What is the standard deviation of the sampling distribution of p-hat? Round to the nearest hundredth. |
Algebraic Expression:
|
|
Hints: |
|
|
|
σ = √(0.64*.36)/50
|
|
σ = 0.07 (rounded)
|
|
C)
Find the probability that the porportion of people who own houses in this sample is between 50% and 60%. Round answers to the nearest hundredth. Link to z-table |
Algebraic Expression:
|
|
Hints: |
|
|
|
|
|
|
|
|
| 34) Problem #PRAJB5X "PRAJB5X - Problem 5" |
|
Describe the Central Limit Theorem to someone who hasn't taken statistics. © STATS4STEM.ORG |
|
Ungraded Open Response: |
| 35) Problem #PRAJB5U "PRAJB5U - 239440 - Problem 2" |
|
Explain the difference between a statistic and a parameter. © STATS4STEM.ORG |
|
Ungraded Open Response: |
| 36) Problem #PRAJB49 "PRAJB49 - 240094 - The mean SAT..." |
|
A)
The SAT scores for students from Boston Latin School are normally distributed with a mean of 1910 with a standard deviation is 450. Ten random students were asked to report their SAT score to their AP Statistics teacher, Mr. Simoneau. What is the probability that the mean of their score will be 2200 or higher? Round answer to the nearest hundredth. Link to z-table. © STATS4STEM.ORG |
Algebraic Expression:
|
|
Hints: |
|
|
|
|
|
|
|
|
|
|
|
|
|
B)
What is the probability that 1 randomly chosen student will have a score of 2200 or higher? Round answer to the nearest hundredth. |
Algebraic Expression:
|
|
Hints: |
|
|
|
|
|
|
|
|
|
|
|
|
| 37) Problem #PRAJB5B "PRAJB5B - 240096 - The central limit..." |
|
The central limit theorem states that an SRS of a large-sized n from any population with mean µ and finite standard deviation σ _________________________ © STATS4STEM.ORG |
Multiple Choice:
|
|
Hints: |
|
|
|
|
| 38) Problem #PRAJB4B "PRAJB4B - 240065 - True or false: &n..." |
| 39) Problem #PRAJB4A "PRAJB4A - 240064 - Is μ a pa..." |
|
A)
Is μ a parameter or a statistic? © STATS4STEM.ORG |
Multiple Choice:
|
|
B)
Is p-hat a parameter or a statistic? |
Multiple Choice:
|
|
C)
Is σ a parameter or a statistic? |
Multiple Choice:
|
| 40) Problem #PRAJB4D "PRAJB4D - 240067 - How do you find t..." |
|
How do you find the standard deviation of the sampling distribution of the sample mean? a) σ/√n b) σ c) s d) σ/n e) None of the above © STATS4STEM.ORG |
Multiple Choice:
|
| 41) Problem #PRAJB4E "PRAJB4E - 240068 - True or fal..." |
|
True or false, p-hat is an unbiased estimator of p? © STATS4STEM.ORG |
Multiple Choice:
|
| 42) Problem #PRAJB32 "PRAJB32 - 240056 - If the mean hours..." |
|
If the mean hours that a high school student spends on facebook a week is 17 hours with a standard deviation of 12 and 100 students were sampled, what is the distribution of the sample mean? © STATS4STEM.ORG |
Multiple Choice:
|
|
Hints: |
|
|
| 43) Problem #PRAJB3U "PRAJB3U - 240050 - The percentage of..." |
|
The percentage of people that score a 550 on the math portion of the SAT is 0.5. In a random sample of 100 students, what is the probability that 60% scored higher than 550? © STATS4STEM.ORG |
Algebraic Expression:
|
|
Hints: |
|
|
|
|
|
|
| 44) Problem #PRAJB3T "PRAJB3T - 240049 - 8) Suppose 38% of..." |
|
A)
38% of American adults say that they are satisfied with their lives. If a random sample of 1000 American adults is taken about their satisfaction with their lives, what is the mean of the sampling distribution of p-hat? © STATS4STEM.ORG |
Algebraic Expression:
|
|
Hints: |
|
|
|
|
|
|
|
B)
What is the standard deviation of the sampling distribution of p-hat? Round answer to the nearest hundredth. JUST SUBMIT 1 as answer |
Algebraic Expression:
|
|
C)
In a random sample of 1000 adults, what is the probability that greater than .4 will respond that they are satisfied with their lives? JUST SUBMIT 1 as answer |
Algebraic Expression:
|
| 45) Problem #PRAJQPV "PRAJQPV - 251211 - A) The histogram ..." |
A)
A) The histogram below was created from the variable thickness from the geophones dataset. Which of the following is correct? © STATS4STEM.ORG |
Multiple Choice:
|
B)
B) Which of the following boxplots most likely represents the distribution of the variable thickness found in part A?    |
Multiple Choice:
|
|
C)
C) If repeated samples of size 100 are drawn from the distribution found in part A, and the sample mean was calculated for each sample, the distribution for the sample means would be: |
Multiple Choice:
|
|
D)
Even if the distribution for a given population is non-normal, the sampling distribution of sample means will be approximately normal due to the: |
Multiple Choice:
|
|
E)
E) The mean of the thickness variable is 269.4 and the standard deviation is 10.4. If repeated samples of size 100 are taken from the thickness data, the sampling distribution of sample means would have which distribution? |
Multiple Choice:
|
|
Hints: |
|
|
| 46) Problem #PRAJQQR "PRAJQQR - 251238 - In the United Sta..." |
|
A)
In the United States, about 17% of the people have blue eyes. Suppose 200 people from this city were sampled. As a decimal, what is the mean of the sampling distribution of p-hat? © STATS4STEM.ORG |
Algebraic Expression:
|
|
Hints: |
|
|
|
|
|
|
|
|
|
|
|
B)
Have the required conditions been met to use the normal approximation for p-hat? Hint: Make sure you remember these requirement and always use them before assuming normality. |
Multiple Choice:
|
|
C)
Which distribution can be used to approximate the sampling distribution of p-hat? |
Multiple Choice:
|
|
Hints: |
|
|
|
D)
What is the probability p-hat will be less than .15? Answer as a decimal rounded to nearest hundred. Link to z-table |
Algebraic Expression:
|
|
Hints: |
|
|
|
z=-0.74 |
|
|
|
|
|
E)
What is the probability p-hat will fall between .13 and .19? Round answer to the nearest hundredth. |
Algebraic Expression:
|
|
Hints: |
|
|
|
|
|
|
|
|
|
|
|
|
|
|
|
F)
What is the probability p-hat will be greater than .20? Round answer to the nearest hundredth. |
Algebraic Expression:
|
|
Hints: |
|
|
|
|
|
|
|
|
|
P(p-hat > 0.20) = 0.1335 ANSWER = 0.13 (ROUNDED) |
|
G)
What is the probability p-hat will be less than .14 or greater than .18? Round answer to the nearest hundredth. |
Algebraic Expression:
|
|
Hints: |
|
|
|
|
|
|
|
|
|
Remember, if A & B are Disjoint. P(A OR B) = P(A) + P(B) |
|
|
|
|
|
|
| 47) Problem #PRAJQUX "PRAJQUX - 251368 - The data for men'..." |
|
A)
The data for men's heights follows a normal sample distribution, with a population mean of 68 inches and a standard deviation of 12 inches. Katy is going to survey a group of 36 men, and is trying to predict the probability of getting a mean of less than 64. What is the z-score? Round answer to the nearest hundredth. © STATS4STEM.ORG |
Algebraic Expression:
|
|
Hints: |
|
|
|
|
|
|
|
B)
What is the probability that Katy will get a mean of less than 64? Round answer to the nearest hundredth. Link to z-table |
Algebraic Expression:
|
|
Hints: |
|
|
|
|
| 48) Problem #PRAJQUY "PRAJQUY - 251369 - The probability o..." |
|
A)
The acceptance rate for students applying to a certain college is 17%. Annabell wants to know what the probability that a random sample of 100 student applications will have an acceptance rate less than 14%. What is the z-score for this scenario? Round answer to the nearest hundredth. © STATS4STEM.ORG |
Algebraic Expression:
|
|
Hints: |
|
|
|
|
|
|
|
B)
What is the probability that a random sample of 100 student applications will have an acceptance rate less than 14%? Round answer to the nearest hundredth. Link to z-table |
Algebraic Expression:
|
|
Hints: |
|
|
|
|
| 49) Problem #PRAJST5 "PRAJST5 - 253265 - In the United Sta..." |
|
A)
In the United States, about 41% of the people have divorces after their first marriage. Suppose 500 people from this city were sampled. As a decimal, what is the mean of the sampling distribution of p-hat? © STATS4STEM.ORG |
Algebraic Expression:
|
|
Hints: |
|
|
|
|
|
|
|
|
|
|
|
B)
Have the required conditions been met to use the normal approximation for p-hat? Hint: Make sure you remember these requirement and always use them before assuming normality. |
Multiple Choice:
|
|
C)
Which distribution can be used to approximate the sampling distribution of p-hat? Round to the nearest hundredth. |
Multiple Choice:
|
|
Hints: |
|
|
|
D)
What is the probability p-hat will be less than .38? Anwer as a decimal rounded to nearest hundred. Link to z-table |
Algebraic Expression:
|
|
Hints: |
|
|
|
z=-1.36 |
|
|
|
|
|
E)
What is the probability p-hat will fall between .40 and .43? Round answer to the nearest hundredth. |
Algebraic Expression:
|
|
Hints: |
|
|
|
|
|
|
|
|
|
|
|
|
|
|
|
F)
What is the probability p-hat will be greater than .39? Round answer to the nearest hundredth. |
Algebraic Expression:
|
|
Hints: |
|
|
|
|
|
|
|
|
|
P(p-hat > 0.39) = 0.8186 ANSWER = 0.82 (ROUNDED) |
|
G)
What is the probability p-hat will be less than .37 or greater than .42? Round answer to the nearest hundredth.
|
Algebraic Expression:
|
|
Hints: |
|
|
|
|
|
|
|
|
|
Remember, if A & B are Disjoint. P(A OR B) = P(A) + P(B) |
|
|
|
|
|
|
|
H)
If the sample size changed to 1500, what would be the new standard deviation? Round answer to the nearest hundredth. |
Algebraic Expression:
|
|
Hints: |
|
|
|
n = 1500 |
|
(0.013) Rounded |
|
I)
As the sample size increases, what happens to the standard deviation of the sample mean? |
Check All That Apply:
|
| 50) Problem #PRAJUW5 "PRAJUW5 - 255280 - In the United Sta..." |
|
A)
In Chicago, about 67.5% of men wear jeans at least once a week. Suppose 800 men from this the city of Chicago were randomly sampled. As a decimal, what is the mean of the sampling distribution of p-hat? © STATS4STEM.ORG |
Algebraic Expression:
|
|
Hints: |
|
|
|
|
|
|
|
|
|
|
|
B)
Have the required conditions been met to use the normal approximation for p-hat? Hint: Make sure you remember these requirement and always use them before assuming normality. |
Multiple Choice:
|
|
C)
Which distribution can be used to approximate the sampling distribution of p-hat? Round to the nearest thousandth. |
Multiple Choice:
|
|
Hints: |
|
|
|
D)
What is the probability p-hat will be less than .65? Anwer as a decimal rounded to nearest hundred. Link to z-table |
Algebraic Expression:
|
|
Hints: |
|
|
|
z=-1.47 |
|
|
|
|
|
E)
What is the probability p-hat will fall between .66 and .70? Round answer to the nearest hundredth. |
Algebraic Expression:
|
|
Hints: |
|
|
|
|
|
|
|
|
|
|
|
|
|
|
|
F)
What is the probability p-hat will be greater than .68? Round answer to the nearest hundredth. |
Algebraic Expression:
|
|
Hints: |
|
|
|
|
|
|
|
|
|
P(p-hat > 0.68) = 0.3859 ANSWER = 0.39 (ROUNDED) |
|
G)
What is the probability p-hat will be less than .65 or greater than .69? Round answer to the nearest hundredth.
|
Algebraic Expression:
|
|
Hints: |
|
|
|
|
|
|
|
|
|
Remember, if A & B are Disjoint. P(A OR B) = P(A) + P(B) |
|
|
|
|
|
|
|
H)
If the sample size changed to 1500, what would be the new standard deviation? Round answer to the nearest thousandth. |
Algebraic Expression:
|
|
Hints: |
|
|
|
n = 1500 |
|
(0.012) or (0.01) Rounded |
|
I)
As the sample size increases, what happens to the standard deviation of the sample mean? |
Check All That Apply:
|
| 51) Problem #PRAJUW4 "PRAJUW4 - 255279 - In the United Sta..." |
|
A)
In the United States, about 58% of boys play a sport in High School. Suppose 400 high school boys from this city were sampled. As a decimal, what is the mean of the sampling distribution of p-hat? © STATS4STEM.ORG |
Algebraic Expression:
|
|
Hints: |
|
|
|
|
|
|
|
|
|
|
|
B)
Have the required conditions been met to use the normal approximation for p-hat? Hint: Make sure you remember these requirement and always use them before assuming normality. |
Multiple Choice:
|
|
C)
Which distribution can be used to approximate the sampling distribution of p-hat? Round to the nearest hundredth. |
Multiple Choice:
|
|
Hints: |
|
|
|
D)
What is the probability p-hat will be less than .56? Anwer as a decimal rounded to nearest hundred. Link to z-table |
Algebraic Expression:
|
|
Hints: |
|
|
|
z=-0.8 |
|
|
|
|
|
E)
What is the probability p-hat will fall between .56 and .62? Round answer to the nearest hundredth. |
Algebraic Expression:
|
|
Hints: |
|
|
|
|
|
|
|
|
|
|
|
|
|
|
|
F)
What is the probability p-hat will be greater than .60? Round answer to the nearest hundredth. |
Algebraic Expression:
|
|
Hints: |
|
|
|
|
|
|
|
|
|
P(p-hat > 0.6) = 0.2119 ANSWER = 0.21 (ROUNDED) |
|
G)
What is the probability p-hat will be less than .57 or greater than .61? Round answer to the nearest hundredth.
|
Algebraic Expression:
|
|
Hints: |
|
|
|
|
|
|
|
|
|
Remember, if A & B are Disjoint. P(A OR B) = P(A) + P(B) |
|
|
|
|
|
|
|
H)
If the sample size changed to 1200, what would be the new standard deviation? Round answer to the nearest hundredth. |
Algebraic Expression:
|
|
Hints: |
|
|
|
n = 1200 |
|
(0.014) or (0.01) Rounded |
|
I)
As the sample size increases, what happens to the standard deviation of the sample mean? |
Check All That Apply:
|
| 52) Problem #PRAJUW6 "PRAJUW6 - 255281 - In the United Sta..." |
|
A)
In the city of Burlington, Vermont, 40% of women wear scarves when the weather drops below freezing. Suppose 100 women from Burlington were randomly sampled. As a decimal, what is the mean of the sampling distribution of p-hat? © STATS4STEM.ORG |
Algebraic Expression:
|
|
Hints: |
|
|
|
|
|
|
|
|
|
|
|
B)
Have the required conditions been met to use the normal approximation for p-hat? Hint: Make sure you remember these requirement and always use them before assuming normality. |
Multiple Choice:
|
|
C)
Which distribution can be used to approximate the sampling distribution of p-hat? Round to the nearest hundredth. |
Multiple Choice:
|
|
Hints: |
|
|
|
D)
What is the probability p-hat will be less than .35? Anwer as a decimal rounded to nearest hundredth. Link to z-table |
Algebraic Expression:
|
|
Hints: |
|
|
|
z=-1 |
|
|
|
|
|
E)
What is the probability p-hat will fall between .33 and .42? Round answer to the nearest hundredth. |
Algebraic Expression:
|
|
Hints: |
|
|
|
|
|
|
|
|
|
|
|
|
|
|
|
F)
What is the probability p-hat will be greater than .47? Round answer to the nearest hundredth. |
Algebraic Expression:
|
|
Hints: |
|
|
|
|
|
|
|
|
|
P(p-hat > 0.47) = 0.0808 ANSWER = 0.08 or 0.1 (ROUNDED) |
|
G)
What is the probability p-hat will be less than .37 or greater than .5? Round answer to the nearest hundredth.
|
Algebraic Expression:
|
|
Hints: |
|
|
|
|
|
|
|
|
|
Remember, if A & B are Disjoint. P(A OR B) = P(A) + P(B) |
|
|
|
|
|
|
|
H)
If the sample size changed to 2000, what would be the new standard deviation? Round answer to the nearest hundredth. |
Algebraic Expression:
|
|
Hints: |
|
|
|
n = 2000 |
|
(0.011) or (0.01) Rounded |
|
I)
As the sample size increases, what happens to the standard deviation of the sample mean? |
Check All That Apply:
|
| 53) Problem #PRAJV7M "PRAJV7M - 256504 - Below is a histog..." |
A)
Below is a histogram from the hills dataset. The dataset provides information about scottish hill races. Below is a histogram of the distance, in miles, of various races.  The above histogram has two vertical lines, one red and one blue. One is the mean and one is the median. Which of the above vertical lines represent the mean? © STATS4STEM.ORG |
Multiple Choice:
|
|
B)
Below are the summary parameters for the distance variable. Which of the following answers would best represent the sampling distribution for sample means drawn from this population? Assume the sample size is 30 and the standard deviation for the population is 5.5. |
Multiple Choice:
|
|
Hints: |
|
For large n, the sampling distribution for sample means can be modeled as:  |
|
C)
Which theorem or law was used to answer the previous question? |
Exact Match (case sensitive):
|
|
Hints: |
|
|
|
D)
Calculate the probability that a random sample mean of size 30 will be greater than 8? Round answer to the nearest hundredth. Link to z-table. |
Algebraic Expression:
|
|
Hints: |
|
|
|
|
|
|
|
P(x-bar > 8) = 1 - 0.68 = 0.32 |
|
E)
For the distance variable, what is the IQR? |
Algebraic Expression:
|
|
Hints: |
|
|
|
|
|
F)
What is the upper threshold limit to determine if there are any outliers in this problem? |
Algebraic Expression:
|
|
Hints: |
|
|
|
|
|
G)
Is the maximum of 28 considered an outlier? |
Multiple Choice:
|
|
H)
The distribution of the distance variable is: |
Multiple Choice:
|
| 54) Problem #PRAJ74A "PRAJ74A - 266011 - A local newspaper..." |
|
A)
A local newspaper randomly asks 200 teens the following question: “Do you use any type of social network?”. It is known that 81% of all teens in this region own at least one subscription to a social network. What is the mean of the sampling distribution for p-hat? Round answer to the nearest hundredth. © STATS4STEM.ORG |
Algebraic Expression:
|
|
Hints: |
|
|
|
|
|
B)
What is the standard deviation of the sampling distribution of p-hat? Round to the nearest hundredth. |
Algebraic Expression:
|
|
Hints: |
|
|
|
σ = √(0.81*.19)/200
|
|
σ = 0.03 (rounded)
|
|
C)
Find the probability that the porportion of teens who subscribe to a social network in this sample is between 75% and 85%. Round to the nearest hundredth. Link to z-table |
Algebraic Expression:
|
|
Hints: |
|
|
|
|
|
|
|
|
| 55) Problem #PRAKBY7 "PRAKBY7 - 269759 - A thousand sample..." |
A)
A thousand samples of size n were drawn from a population to estimate an unknown parameter, p - the proportion of individuals in the population who text daily. The thousand recorded p-hats were used to create the sampling distribution for p-hat that is found below.  Using the sampling distribution for p-hat, estimate p. © STATS4STEM.ORG |
Algebraic Expression:
|
|
Hints: |
|
|
|
|
|
B)
Because p is found at the center of the sampling distribution of p-hat, we can say that p-hat is a(n) _____________________________ estimator. |
Exact Match (case sensitive):
|
|
Hints: |
|
|
|
C)
Through visual inspection of the sampling distribution shown above, estimate the standard deviation of the sampling distrion of p-hat. |
Algebraic Expression:
|
|
Hints: |
|
|
|
|
|
D)
Estimate the sample size of each individual sample to get the sampling distribution found above. Choose from the most appropriate answers found below. |
Multiple Choice:
|
|
Hints: |
 |
|
|
|
|
| 56) Problem #PRAJB29 "PRAJB29 - 240032 - The average age o..." |
|
The average age of a car in Japan is 7 years or 84 months with a σ of 16 months. We selected 36 random cars. What is the probability that the mean is greater than 90? Round answer to nearest hundreth. Link to z-table © STATS4STEM.ORG |
Algebraic Expression:
|
|
Hints: |
|
|
|
|
|
|
|
|
|
|
|
|
|
|